In this discussion we look at the building blocks needed to understand supply chain risk across the enterprise and dig deep into the cost structure of mining tires to answer the following questions:
- What are the drivers behind the rise and fall of mining tire prices in different regions?
- What are the bottlenecks with your supply of mining tires?
- What does the future look like for key mining tire suppliers?
How is COVID-19 Affecting Global Mining Operations?
Travel restrictions and social distancing measures imposed in an effort to curb the spread of the COVID-19 pandemic are leading to slowdowns and holds on mining projects, which will potentially have future implications on commodity pricing.
Due to COVID-19, global demand for key metals in the manufacturing and construction sectors has dampened, resulting in suppressed prices. While this will negatively impact higher-cost mining projects, the effect will be potentially offset by lower energy costs due to low oil prices.
Mining Operations at a Glance
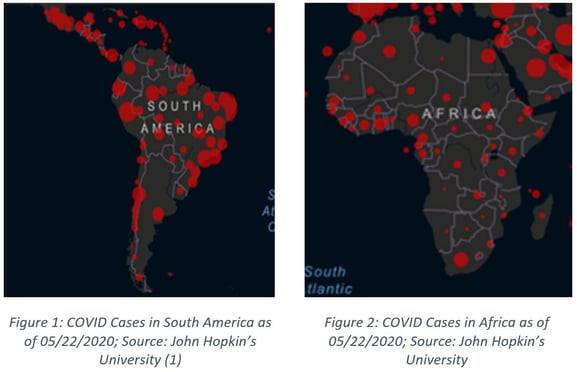
- As the number of COVID cases grows in South America and Africa, with cases in Brazil skyrocketing as of late, mining operations in these regions have not only faced supply constraints from sourcing abroad but have also faced direct impacts as operations needed to be temporarily halted or reduced to enact appropriate health and safety measures.
- Emergency lockdowns in Chile and Peru placed at risk significant flows of copper, zinc and lead concentrates. Analysts at Bank of Nova Scotia estimated a two-week halt in operations would lead to 325,000 tons of lost copper production — roughly 4% of their combined annual output (2).
- Underground mining operations have been especially exposed, given the close working conditions and the large use of migrant labor, in addition to mining workers being more vulnerable to COVID-19, with the average workforce over 40 years old.
How is COVID-19 Affecting Your Supply of Mining Tires?
COVID-19 will have impacts on the prices of tires as well as on your ability to source them. Understanding the underlying cost structure of mining tires is integral in being able to assess your market exposure and supply constraints.
Assessing Market Exposure
Amid a global pandemic, understanding enterprise supply chain risk is more important than ever. Identifying market risk across this entire supply is dependent on the ability to map turnkey mining cost models to your own spend profile in order to assess supply chain risk across the enterprise.
Following is an example of supply chain spend categories and the corresponding enterprise market exposure heat map. When an organization understands its own item-by-item spend breakdown along with corresponding cost models, a holistic view of risk and opportunities across the enterprise becomes possible.
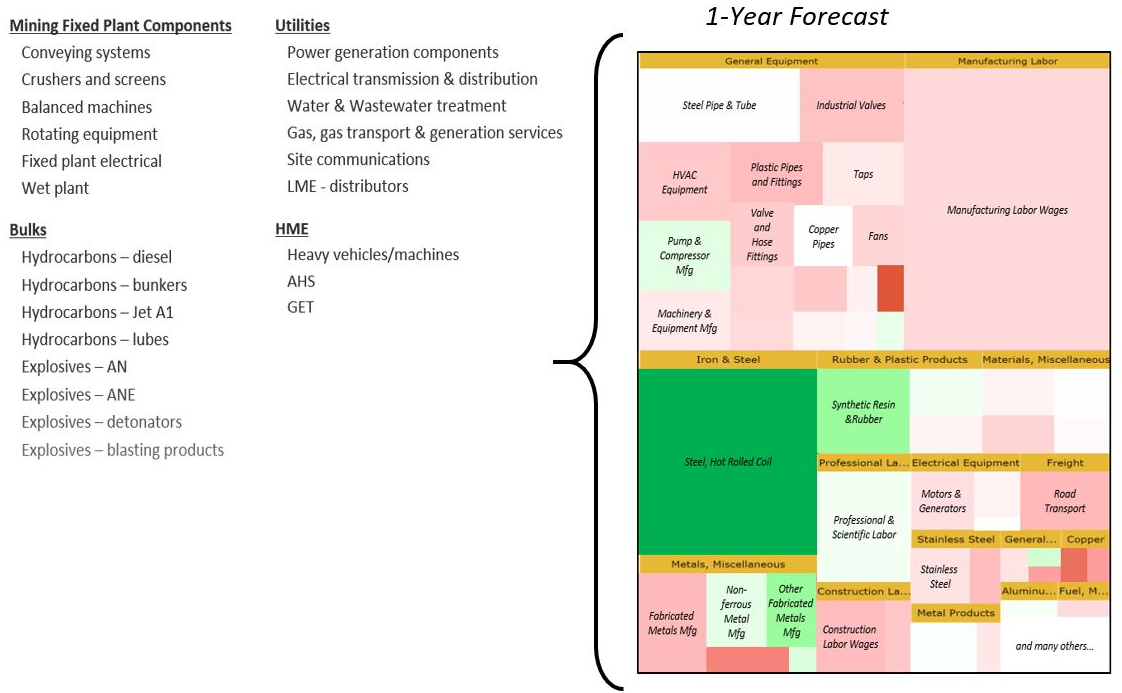 Figure 3: Example of Assessing Enterprise Market Exposure; Source: PowerAdvocate
Cost Models: A Key Input for Understanding Market Exposure
Into 2021, Canadian mining tire prices are expected to decline by over 5% whereas Australian mining tire prices are expected to rise by over 3%. Why? Understanding the cost breakdown of mining tires is key to answering this question. Let’s dive deeper.
Canadian Mining Tires
The first step in understanding costs and overarching market exposure for various materials, equipment, and services is identifying cost components for each and tracking their respective markets with commodity data. Following is the cost breakdown of Canadian mining tires:
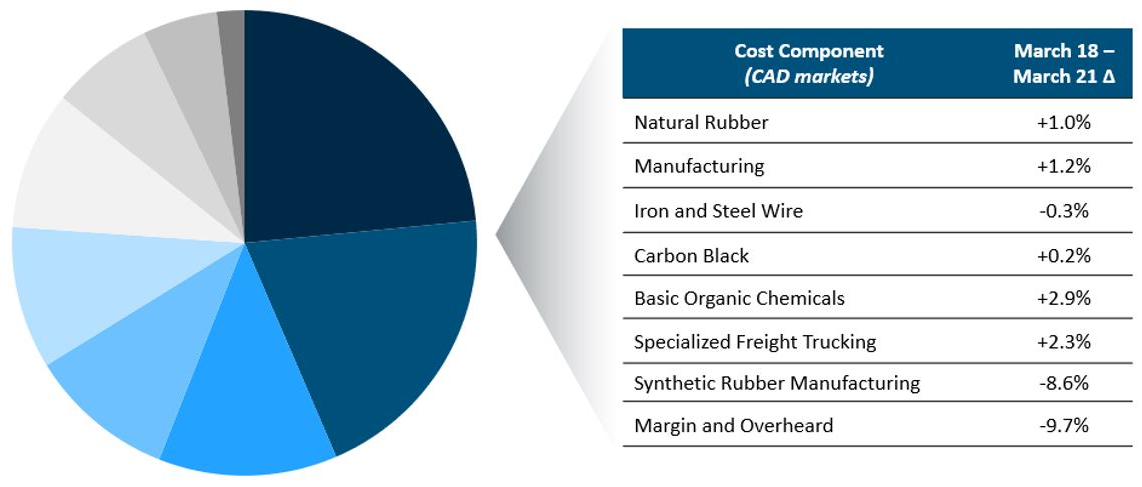
Figure 4: Canadian Mining Tires Cost Breakdown; Source: PowerAdvocate
Each cost component in the above Figure 4 is driven by dynamic commodity movements, as shown below in Figure 5. These are weighted and aggregated into an overall should-cost model as shown in Figure 6 thereby providing visibility into key cost drivers. In the case of mining tires in Canada, from March 2018 through to March 2021, the cost of mining tires is expected to decrease by over 5%.
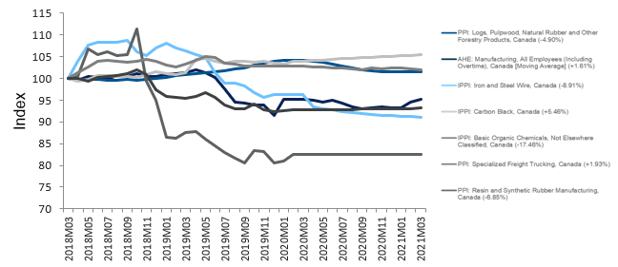
Figure 5: Canadian Tires Commodity Trends; Source: PowerAdvocate
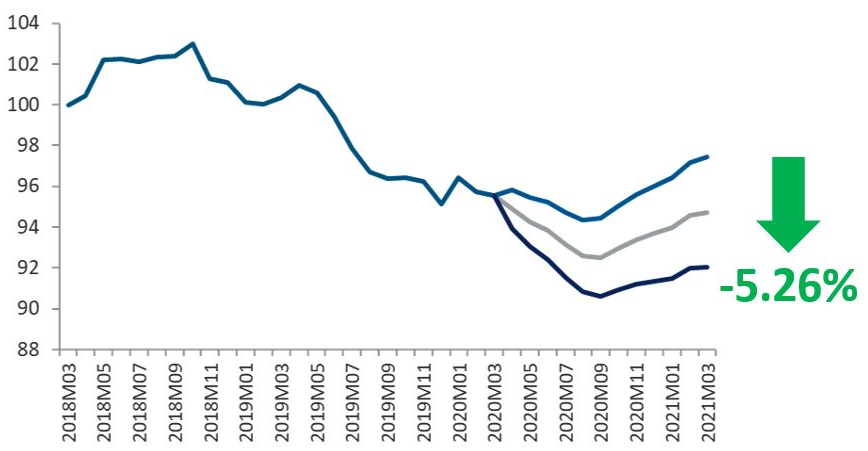
Figure 6: Canadian Tire Should-Cost Model; Source: PowerAdvocate
Why Are the Prices of Canadian Mining Tires Falling?
- The cost of manufacturing tires in Canada fell alongside Canadian oil prices at the end of 2018 and into 2019, which led to reduced raw material costs for the chemical industry and caused basic organic chemical prices to fall.
- Steel prices in Canada rose after the US imposed 25% tariffs on Canadian steel in May 2018 and Canada responded by enacting similar countermeasures in July 2018. All tariffs were subsequently removed in May 2019, thereby reducing some of the pricing pressure, as both countries worked on the new USMCA agreement, which is expected to go into effect July 1, 2020.
- Given the current economic situation due to the COVID-19 pandemic, further downward pressure is expected on tire prices driven by halted mining operations and thus a lower demand, with anticipated recovery into 2021.
Australian Mining Tires
The cost structure of tires manufactured in Australia is quite similar to that of Canada, but is configured based on data availability within Australia.
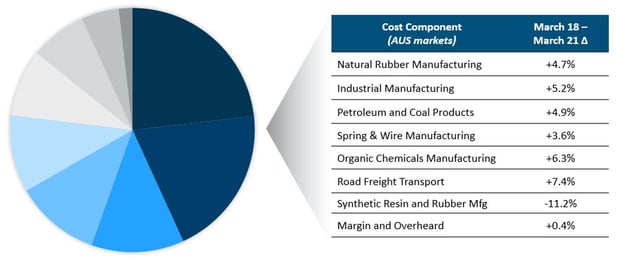
Figure 7: Australian Mining Tires Cost Breakdown; Source: PowerAdvocate
Local market data is key to understanding different regional trends and helps to explain why costs appear to be increasing by more than 3% in Australia compared to the greater than 5% price decrease anticipated in Canada.
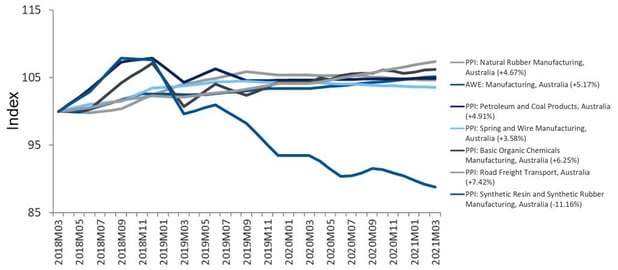
Figure 8: Australian Tires Commodity Trends; Source: PowerAdvocate
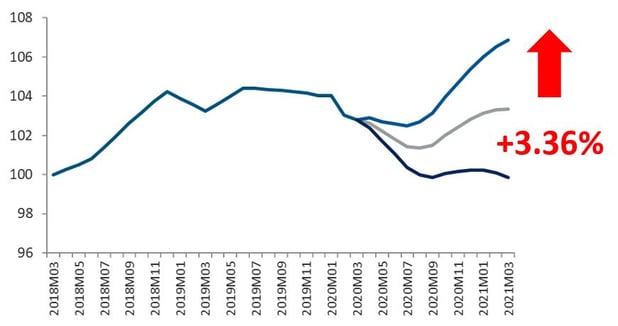
Figure 9: Australian Tire Should-Cost Model; Source: PowerAdvocate
Why Are the Prices of Australian Mining Tires Increasing?
- Australia saw a 3.5% increase in manufacturing minimum wages in July 2018 which increased the labour costs of manufacturing mining tires in Australia.
- LNG exports have added pressure on domestic gas prices, with rising gas costs impacting chemical costs both as an energy and raw material input over the past few years, resulting in upward pressure on the costs of organic chemicals manufacturing.
- High domestic fuel costs caused surges in freight and transportation expenses which have been outpacing inflation in Australia since 2017 and into 2020.
What Are the Bottlenecks for the Mining Tire Supply Chain?
Top earthmoving tire suppliers, like Michelin and Bridgestone, largely have their manufacturing supply chains based in North America, Europe, and Asia, with a few operations in Brazil and South Africa. Therefore, for South American and African countries who are engaged in mining activity, overseas shipping can become a choke point if they are unable to source domestically.
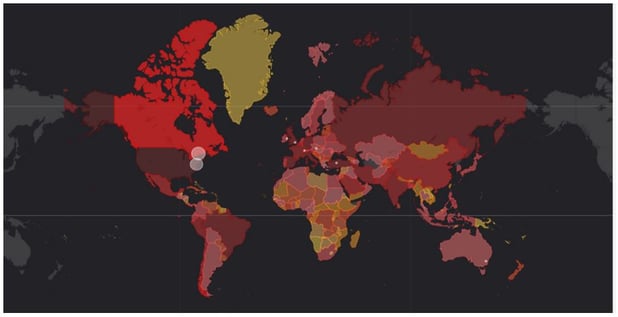
Figure 10: Global COVID Case Heat Map; Source: PowerAdvocate
To mitigate this risk, tracking any port restrictions and planning accordingly will be key to ensuring the flow of supply. One mining CEO was recently quoted saying “It’s not the orders and it’s not the production, it’s (about) can we get it shipped?” Can we get the vessels? Can we get the containers?”. Additionally, as supply chains continue to be disrupted, understanding where there could be a geographical concentration of key materials, such as rubber, will be important to identify other supply chain vulnerabilities.
Future Outlook: How Healthy Are Your Tire Suppliers?
How does Michelin or Bridgestone’s reduced capacity impact the supply chain?
Despite year-over-year weakness in mining tire demand, the market for large-diameter tires is holding relatively steady. Raw materials price drops are expected to lead to a positive net price-mix to raw materials ratio which will help suppliers counter the impact of lower volumes.
Michelin Factories
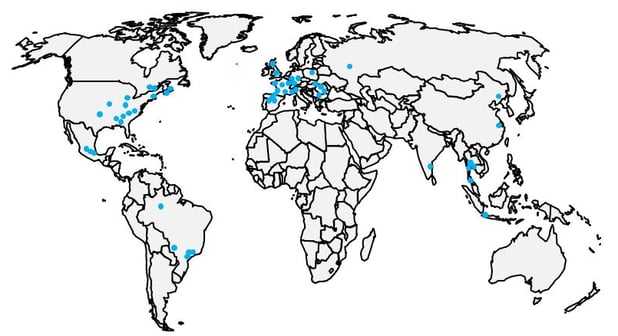
Figure 11: Michelin Factory Locations. Source: Recreated by PowerAdvocate with Bloomberg data.
- Began a phased shutdown of its tire production facilities in the US and Canada starting on March 23. As of late April, production has restarted in China and France, with partial operations reopening in North America as well.
- The first quarter of 2020 saw an 8.3% decline in sales year-over-year, with truck tire markets falling 17% year-over-year, although specialty business in mining and agricultural markets showed some resilience
- Stress tests show that they have sufficient cash to support volume declines of 20-35% over the coming year
- Fiscal Year 2019 showed 26% profit growth in their RS3 segment (mainly due to mining tires) but company expects a sales decline in fiscal 2020 due to inventory adjustments
Bridgestone Factories
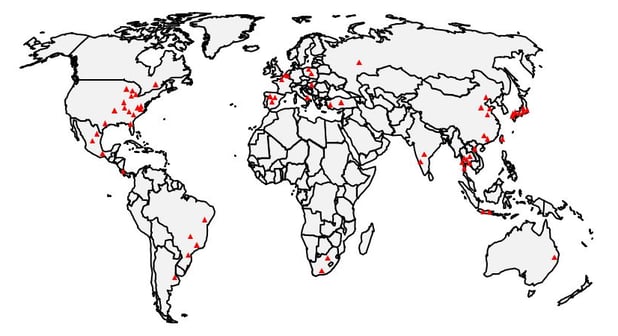
Figure 12: Bridgestone Factory Location. Source: Created by PowerAdvocate with public information from https://www.bridgestoneamericas.com/en/contact-us/locations/manufacturing-facilities
- All North American facilities were closed March 21 to April 13. As of April 16, operations at 19 out of 51 overseas tire factories had been suspended to reduce production and align with weaker demand.
- Eight tire plants in Japan were suspended during April 29 – May 8 as part of Golden Week holidays and as cases continued to grow in the country
- Currently Bridgestone is executing the final phase of its restart plan for its manufacturing operations in North America and Latin America. The company is targeting the end of May for these plants to resume operations.
- Bridgestone recently acquired Reiff Reifen und Autotechnik GmbH, a German specialist tire trade group, including a retreading plant and retail.
- Following a joint collaboration on the iTrack system, a mining tire monitor, Transense Technologies PLC extends its exclusivity contract with Bridgestone to end of May.
- Bridgestone is building upon strength of strong cash flows and has secured borrowings from banks in addition to other crisis response capital measures to ensure sufficient liquidity in the event the impacts of COVID-19 are prolonged.
Interested in learning more about how global economic shifts could impact your costs, or about the data in this post? Please reach out here.
Sources: