The scatterplot results from our previous blog post reveal two findings around utility gas distribution replacement rates that surprised us. First, our analysis shows that at the current rate of replacement, the majority of the industry will require at least 25 years to complete their programs. Second, we find capable, prominent companies plotted on the bottom of the y-axis – near a zero percent Replacement Rate. There are two metrics that help shed some light on what’s behind these findings.
Data-informed replacement performance metrics would be of benefit to utilities as they review current performance and roadmaps for the future. PowerAdvocate proposes the regular usage of two new “Replacement Performance” metrics: “Replacement Rate” and “Anticipated Remaining Program Spend.” These metrics helps fulfill utility desire to measure replacement performance both against industry peers and against internal timelines. The scatterplot below can be a starting point for these assessments.
Gas Distribution Replacement Rates - Top U.S. Utilities
Mains and Services, including Cast Iron, Bare Steel and Pre-1970s Plastic
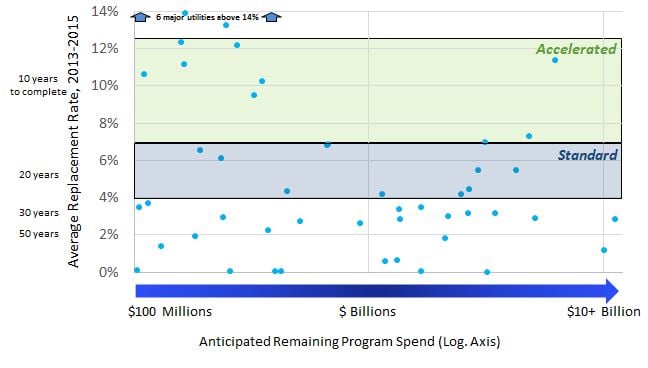
(source: PowerAdvocate analysis of U.S. DOT PHMSA data and PowerAdvocate Energy FactBaseTM data)
Chart Your Performance
The scatterplot dataset represents the top 50 U.S. gas utilities by Anticipated Remaining Program Spend. While not explicitly detailed on this chart, by digging into the dataset behind this analysis, utilities can find their “peer group” along dimensions such as geography, terrain, and Anticipated Remaining Program Spend within this scatterplot dataset.
By comparing Replacement Rate and Anticipated Remaining Program Spend metrics to others utilities can gain an objective perspective on how they're doing. For example, we found instances where one or two companies are “out-replacing” their peers, sometimes at a 40 or 50 percent faster pace.
Put Replacement Performance Metrics to Work
PowerAdvocate’s Gas Transmission and Distribution (T&D) practice area derived a number of key insights through interpretation of this data. The following three findings are intended to help strategy directors, gas program managers, and other capital project and procurement decision makers put the two metrics, Replacement Rate and Anticipated Remaining Program Spend, to work for their organization:
- Companies below the 4% line likely need to ramp up activity in the coming years. Regulators may appreciate the context of your Anticipated Remaining Program Spend and years to completion when they consider your next rate case. If you plan to ramp up your replacement spend, you’ll also want to understand how others have succeeded in this market and the associated program strategies used. If you suspect your organization falls in this portion of the chart, a good first step would be to identify peers that may be performing better and understand the differences.
- Companies in the top-left are nearing completion and possibly ramping down. These organizations face important demand and resource planning work. If you’re here, you’ll likely need to understand how to effectively ramp down and reallocate and/or reduce internal and external resources. This means it will be critical to understand demand in other related areas such as pipeline maintenance and integrity and gas transmission, which will allow you to first reallocate resources before adding new ones that may not be required.
- Companies in the top-right are facing the challenge head-on and are the industry’s biggest spenders. If you are among this cohort, it’s more important than ever to assess your performance and continually improve. A key to success here is having the confidence that your total costs of replacement are prudent.
Influence the Cost of Replacement
Understanding where your company is on the chart can help inform decision making. We also understand that some utilities may believe that Replacement Rate is not a metric that should be tracked. These companies tend to believe that their volume of infrastructure assets to be replaced on a year-over-year basis is not under their control. There are a number of factors shaping this perception, including fixed funding availability (from rate cases and other regulatory mechanisms) and day-to-day tactical project pressures (such as meeting safety standards and supporting more new pipeline construction demands in labor constrained markets).
Many program managers in particular may feel that with a fixed amount of funding there isn’t much they can do to improve their Replacement Rate performance. However, by unlocking cost efficiencies through strategic procurement approaches, it IS possible to influence the total cost of replacement. If cost efficiencies are the key to a faster Replacement Rate, a program manager would be interested in understanding which variables they can directly influence to reduce costs and which they cannot.
We’ve broken down the total cost of replacement into two basic cost drivers to simplify the concept: Unit Cost × Unit Volume = Total Cost. The key cost drivers, and the relationships between them, are illustrated in the figure below. “Cost of Replacement” in this figure would map to the concept of “Unit Cost” and “Volume” to “Unit Volume”.
Total Cost of Replacement Framework
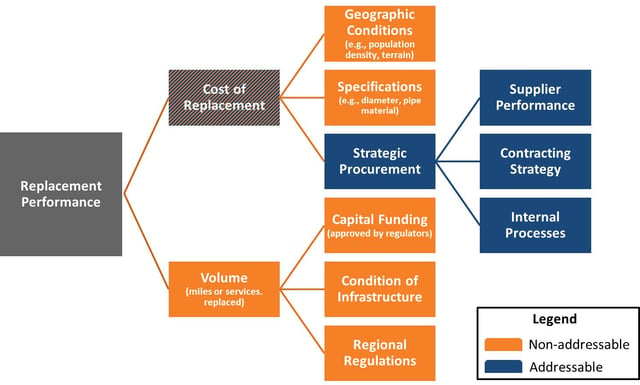
(source: PowerAdvocate)
Making Room for More Replacement
This Total Cost framework brings up an important point. While the volume of problematic infrastructure that needs to be replaced in the field for each utility is out of their control, a sound procurement strategy can have a strong influence on Cost of Replacement.
Strategic procurement can lower the Cost of Replacement, helping to make room for additional Volume of replacement work to be completed on an annual basis. This in turn leads to stronger Replacement Performance in terms of Replacement Rate and Anticipated Remaining Program Spend.
From this perspective it becomes clear that strategic utility decision-making actually CAN influence Replacement Rate. Drivers that previously seemed “fixed” or non-addressable are indeed addressable via strategic procurement. And Replacement Rate might be one of the ways to track changes in Cost of Replacement over time.
Accelerating with Strategic Procurement
While Replacement Rate metrics can serve as valuable tools, they must also be considered in a broader context as there are considerable constraints that lay before a major change in performance can be made. Safety remains concern number one for all stakeholders - utilities, ratepayers, shareholders, and regulators alike. Even though general company and customer expectations may align with a 25-year replacement timeline, our analysis suggests that for the majority of utilities it will take longer than 25 years. Where can utilities go from here?
PowerAdvocate’s experience shows that benchmarking programs against utility peers is a best practice. Whether it’s getting an idea of how your program’s replacement rate compares to relevant peers, or finding out exactly how your total cost per mile of gas main compares to the industry, we have helped a number of clients secure data-driven insights and take action.
No matter where your utility plots on the original scatterplot, overall a more strategic procurement approach may be the key differentiator at play here. Strategic procurement can enable two companies with similar program constraints to operate at very different Replacement Rates and Costs of Replacement (e.g., $/mile costs).
We’ll dive into a deeper discussion on strategic procurement in a future blog post. In the meantime, here are two example strategic procurement activities we’ve seen top performers use with success:
- Monitor performance closely and reallocate work to best-fit contractor on periodic basis (quarterly, semi-annually, or annually)
- Improve 1-3 year demand planning, which will help shore up supply and identify whether particular initiatives to increase supply capacity are required (if ramping up a program)
This is the second in our series of posts on the U.S. gas distribution sector, lead by PowerAdvocate's Gas T&D practice area. Read the first post in the series, How Does You Gas Distribution Replacement Rate Compare with Utility Peers?
Want to find out how your gas replacement rate compares with peer utilities?