In periods of rapid economic change, energy firms need to know where they are most vulnerable to rising costs. The recent volatility of commodity markets - and the uncertain fate of policies like President Biden's $1.2T infrastructure plan currently being debated in Congress - highlight the challenge that procurement teams face in estimating the expected impact on their budgets.
Steel prices have more than doubled over the past year. To manage commodity uncertainty, PowerAdvocate leveraged our should-cost models to test cost inflation expectations across a range of products and services under different commodity price sensitivity scenarios. In one of those scenarios, PowerAdvocate evaluated the impacts of high steel prices, in which steel prices climb by another 20% from today's levels, to show the impact on specific procurement categories for a typical utility's supply chain.
The table below shows the potential cost impact across 10 key procurement categories for utilities. Categories with high exposure to steel prices could see significant cost swings: for a 20% increase in steel prices, spending on piping for a utility with $3B in annual supply chain spend is estimated to increase by 10%. For a category with a somewhat lower exposure to steel, like switchgear, spending is expected to rise by about 1% under a 20% steel price increase scenario. PowerAdvocate builds scenarios based on our database of >$6T of energy supply chain spend and >10K economic cost indices, with the ability to customize key procurement categories for any utility.
Budgetary Impact of a High Steel Price Scenario (+20%) for a Sample Utility with $3B in Annual Supply Chain Spend
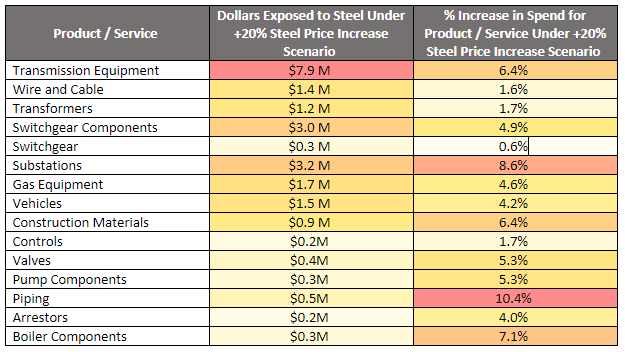
Table 1. The above table represents the budgetary impacts that high steel prices (20% higher than June 2021 levels) could have for a utility with ~$3B in annual sourceable spend across a handful of top spend products and services. Categories are ranked by total annual spend. Dollars exposed are based on a combination of the level of exposure each product or service has to steel markets as well as the spend volumes across each product or service for this utility.