As global economies recover from the economic downturn, a combination of market forces is creating an inflationary cost environment for energy and natural resources firms. Severe shortages for key commodities, materials, and labor have businesses scrambling to mitigate the operational downsides, including longer lead times for critical equipment.
In this initial post to our multi-part series, we summarize the market forces driving shortages and inflationary costs for energy and natural resources firms. In part two, we’ll dive deeper into those market forces and share results from a recent PowerAdvocate survey conducted to measure the impact of today’s market environment on equipment lead times.
Key Market Forces Driving Shortages
Supply Lagging Demand
Following the onset of COVID-19 and an initial drop in demand, manufacturers severely reduced production, reaching unprecedented levels of contraction in the manufacturing sector by April 2020. Exacerbated by the multi-trillion-dollar government stimulus package, consumers under stay-at-home orders ramped up spending that led to rapidly depleting inventories. Meanwhile, capital spending is increasing faster than it did during previous recoveries and investments in renewables and transmission infrastructure has increased.
Manufacturers are still playing catch-up and, as a result, energy and natural resources companies will continue to see a mismatch of supply and demand. The manufacturing Purchasing Manager’s Index (PMI) is now at its highest-ever level of 63 indicating rapid growth in output, while equipment lead-times for critical infrastructure have shot upwards of 64% portending the disruption that lead time delays will continue to have on manufacturing output.
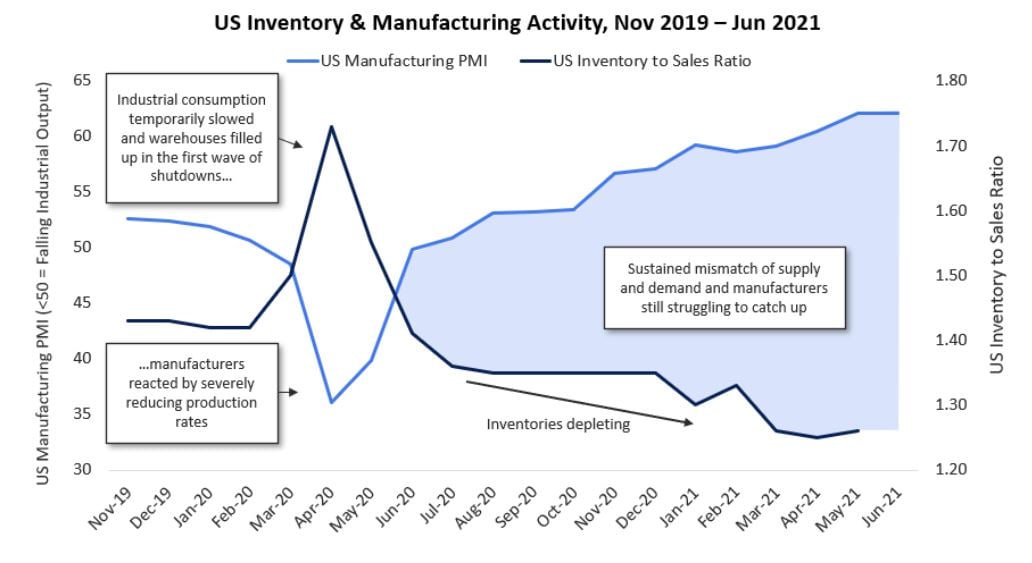
Figure 1. The US Inventory to Sales Ratio covers total business across a variety of industries and is derived from surveys conducted by the US Census Bureau. The US Markit Manufacturing Purchasing Managers Index (PMI) measures the performance of the manufacturing sector and is derived from a survey of 600 industrial companies. Levels under 50 indicate falling manufacturing output.
Freight Capacity Shortages:
When the pandemic struck, freight demand collapsed, and global trade volumes shrank by 3.3% per month from January to May 2020. After the first wave of pandemic-related shutdowns ended mid-2020, freight demand came roaring back. Global trade volumes grew by 7.8% in June 2020 and then 2.3% a month from June 2020 to the present – the largest sustained increase in over a decade. But shipping companies have struggled to keep pace, contributing to a global shortage of sea freight containers, increased traffic at the world’s busiest ports, and sky-rocketing container prices.
While the backlog has eased in recent months, a domestic shortage of truck drivers has compounded the freight issue. After a period of historically low demand for trucking services in March-May 2020, demand steadily increased through the second half of 2020 as trucking companies struggled to find workers willing to work during the pandemic. With a tight market, freight prices increased and lead times and backlogs for shipments grew, further exacerbating shortages across supply chains.
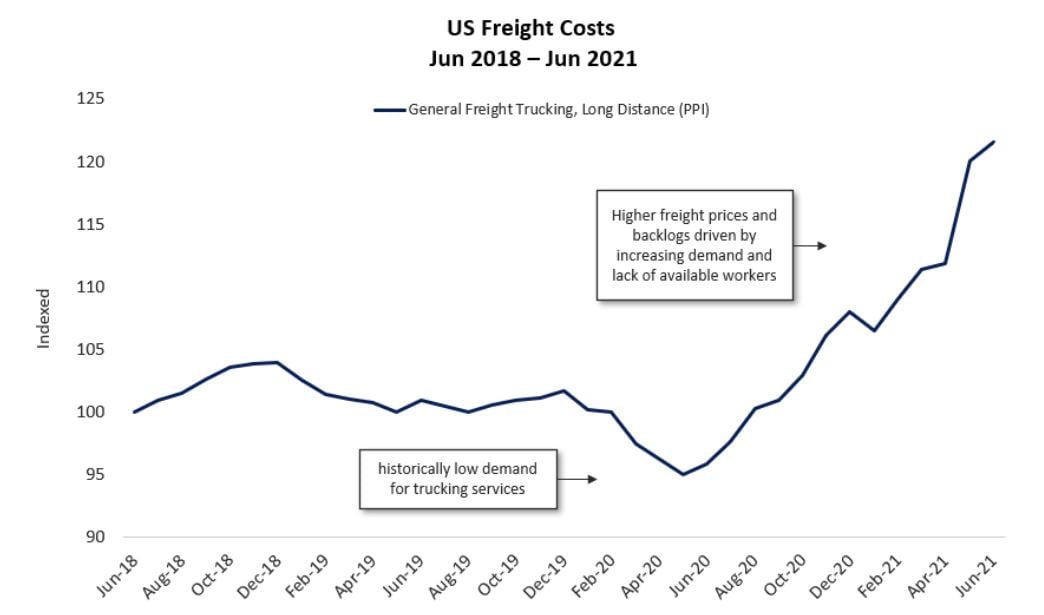
Figure 2. The General Freight Trucking, Long Distance Producer Price Index (PPI) captures costs to the seller of transporting a wide range of goods across the US via truck. Freight trucking has increased by over 30% from its historically low demand in June 2020.
Labor Constraints:
As manufacturers ramp up hiring to increase production, many US firms are facing barriers in recruiting qualified workers. Currently, there are 9.3 million open jobs across the economy, an all-time high, but the unemployment rate remains stubbornly high with 7 million workers still out of work. Employers are increasingly finding themselves forced to raise wages to coax workers back onto production lines, which many employers are reluctant to do. The shortage is likely to ease as vaccination rates climb, but there are signs that this could take more than a few months.
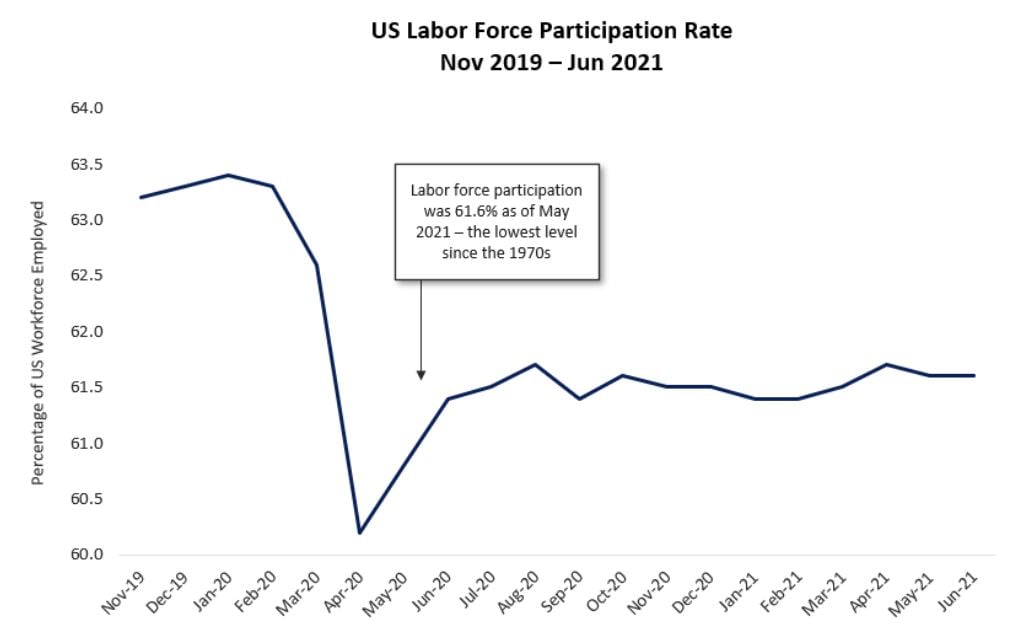
Figure 3. The US Labor Force Participation Rate indicates a sharp decline in US workforce at the onset of COVID-19 and has still not recovered to pre-pandemic levels.
Implications for Energy & Natural Resources Firms
What does this mean to energy firms and their supplier’s near-term future? PowerAdvocate recently surveyed dozens of the energy industry’s top equipment providers to measure lead time exposure and market movements. The path forward lies in empowering the supply chain with accurate, specific, and current lead time information that can inform both short term and long-term operational and supply chain strategies. Check back next week at costinsights.com to download the whitepaper with our survey results.