This post lays out the details behind a tactical execution of Supplier Distribution Analysis (if you’re not sure what Supplier Distribution Analysis is, check out our high-level intro piece on the subject), and provides strategies for consolidating spend around top suppliers. Specifically, it outlines:
- Data requirements: What data do you need access to?
- Steps of the analysis: What are the steps to follow in running the analysis?
- Suggestions on execution: How have we seen other companies actually execute and realize the savings opportunities uncovered by the analysis?
Data Requirements
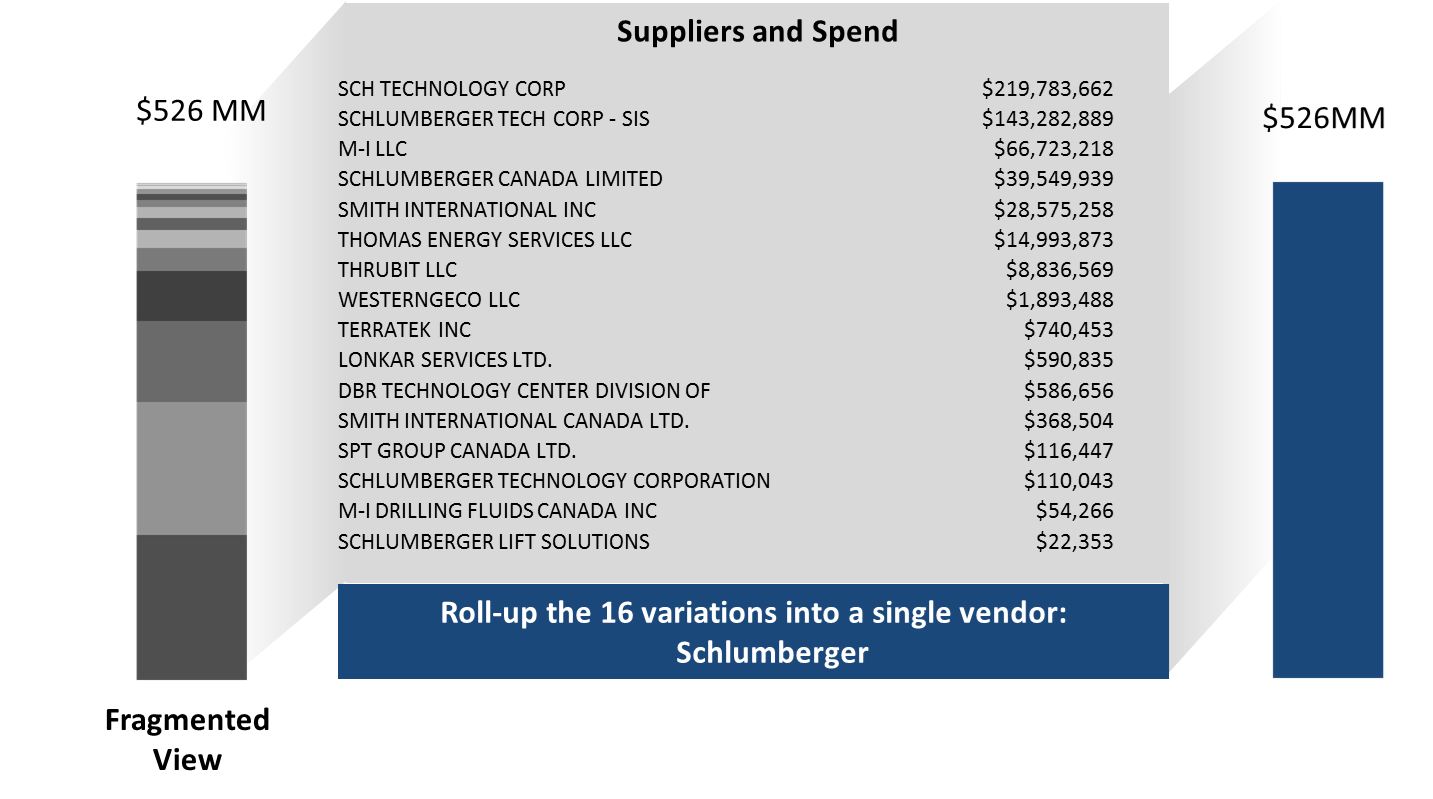
This analysis requires complete visibility into spend by supplier. It’s critical that spend with subsidiaries be rolled up to their ‘parent’ organizations. We recognize that many E&P firms’ spend data does not include cleanly aggregated parent/child structures; if you have this problem, we can help – just ask us how.
Fully Rolled-Up Supplier Families: Without complete and accurate supplier hierarchies, this analysis will produce results that mislead your consolidation efforts, and ultimately cost you significant discounts. For one, you may fail to consider certain vendors as top suppliers because their subsidiaries have not been rolled up, making them appear smaller than they are. Second, you will likely make decisions based on distributions and vendor-to-vendor benchmarks that are incorrect, which will cost you leverage, credibility, and savings at the negotiation table.
To underscore the importance of proper supplier organizations, we’ve provided the chart below, which depicts a PowerAdvocate client before and after it invested in supplier familying.
How to Run the Analysis and Identify the Savings Opportunity
With the right data quality, conducting this analysis is a quick, straightforward process. Here are the steps required to identify savings opportunities using Supplier Distribution Analysis:
- Rank-order your top suppliers.
- Export summarized spend data with your top supplier by category for the last four quarters. If a summarized export is not possible, export this data in transactional form, and create a pivot table in Excel to achieve aggregated spend amounts.
- Then, export summarized spend by supplier for all the categories your top supplier is represented in. Again, a pivot table may be necessary here.
- Average your total spend amounts with your five largest suppliers in each of these categories, including your top supplier.
- Create a column chart that reflects, for each of these categories, the amount you spent with your top supplier and the average amount you spent with your top five suppliers.
- Repeat Steps 1 – 5 for as many suppliers as you see fit. Each output should look something like this:
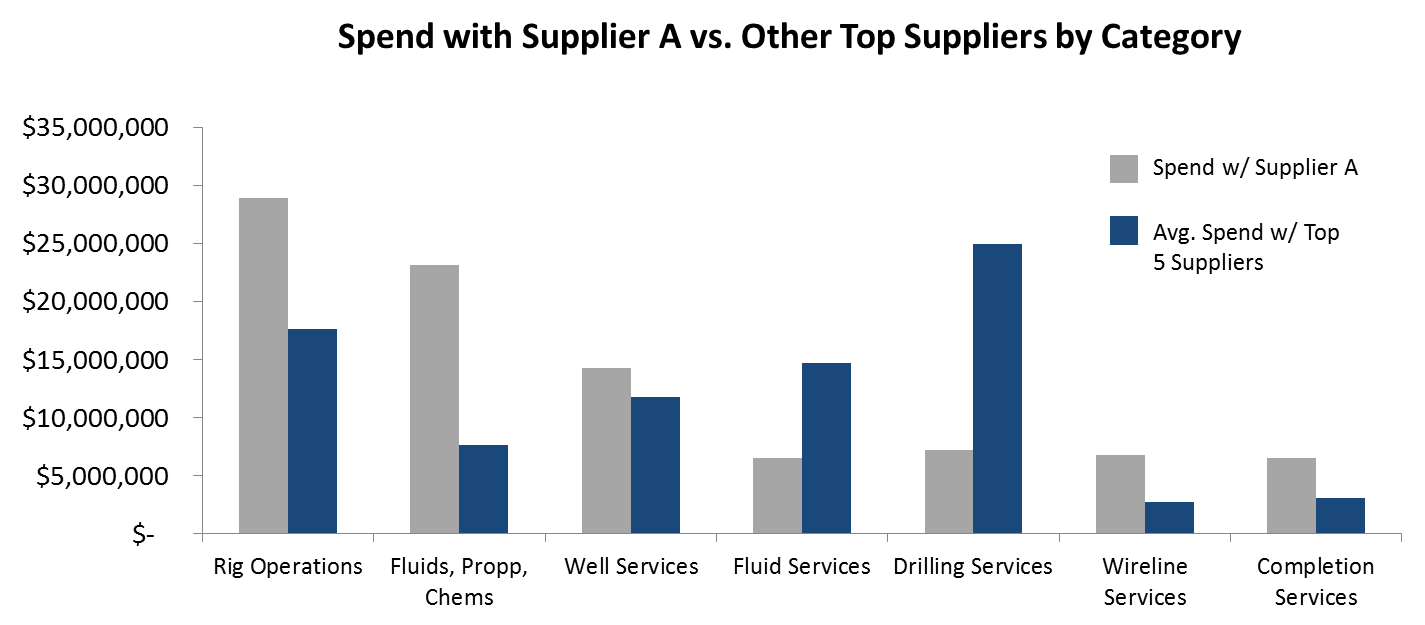
How to Execute on the Savings Opportunity
Once you’ve conducted a Supplier Distribution Analysis, your potential consolidation opportunities should be quite apparent; look for areas where the average spend with your top five suppliers is higher than your spend with the supplier you’re conducting the analysis on. For instance, in the graph above, the biggest opportunities with Supplier A appear to be in Fluid and Drilling Services. Once you’ve identified this low-hanging fruit, you’ll need to take three courses of action to fully realize savings: (1) Determine which opportunities are actionable, (2) Renegotiate contracts around consolidation, and (3) Ensure contract compliance.
Evaluating Opportunities: Not every potential opportunity will be actionable. For instance, you may not be able to consolidate spend on certain specialty services with a top supplier because this supplier simply does not offer these services. Thus, determining which spend allocations can be feasibly redistributed is a key first step to take.
Renegotiating Contracts: Before redistributing future category spend around a supplier, you need to renegotiate discounts with this supplier that fully compensate you for this consolidation. You should leverage the data from your Supplier Distribution Analysis in these talks, and highlight how much you spend with the supplier across other categories.
Ensuring Contract Compliance: Once you’ve cut a fresh contract around redistributed spend with a supplier, you cannot assume your teams in the field will adhere to it. Through whatever internal training or directive processes you have, you need to ensure that the new business promised to the supplier is, in fact, delivered to them. If you follow these three steps, and repeat this process across all of your major suppliers, you should achieve 10%+ savings across newly consolidated categories.
Need help accessing the data needed for this (and other) analysis?
Need help running the analysis?
Need help executing supplier negotiations?
We can help – ask us how.