This post lays out the details behind a tactical execution of ‘should-cost’ analysis. Specifically, it outlines:
- Data requirements: What data do you need access to?
- Steps of the analysis: What are the steps to follow in running the should-cost analysis?
- Suggestions on execution: How have we seen other companies actually execute and realize the savings opportunities uncovered by the should-cost analysis?
Data Requirements
Below is the data needed to effectively run this analysis. If you do not have access to all this data, you are not alone…many E&P companies are in the same boat. We can help – just ask us how.
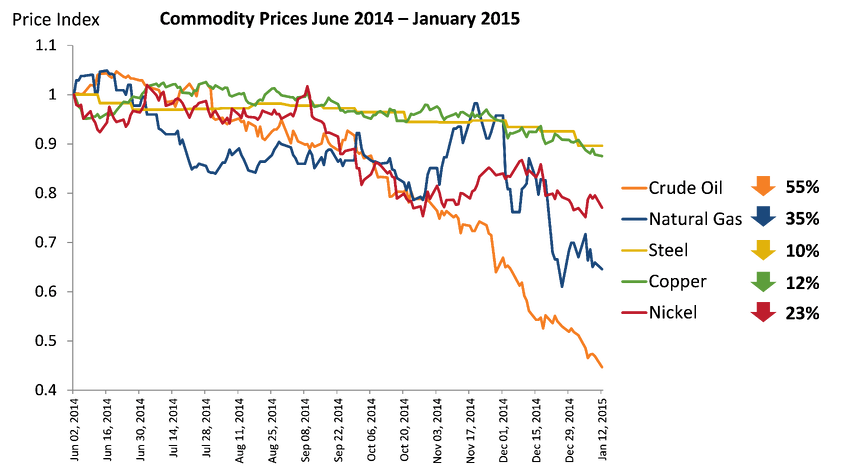
1. Commodity Price Movements: It’s not just crude oil prices that have declined recently. Between June 2014 and January 2015, crude, natural gas, steel, copper, and nickel have dropped in price 55%, 35%, 10%, 12%, and 23% respectively. This means lower costs for your suppliers to manufacture and deliver the materials you buy from them.
4. Item-Level Cost Model: Item-level material cost models provide visibility into what underlying factors are driving the costs of a particular item that you buy. An illustration is provided in the following section.
5. Should-Cost Model: ‘Should-cost’ models combine the item-level cost models with indices and forecasts around the cost drivers to predict what an item ‘should cost’ based on recent or anticipated market movements. An illustration is provided in the following section.
How to Run the Analysis and Identify the Savings Opportunity
While should-cost modeling may sound complex, it is actually quite simple in practice if your team has access to the requisite data. Below are the steps required to identify savings opportunities using should-cost:
- Rank order your top spend items
- Identify which high spend items have been meaningfully impacted by shifts in market conditions, be that movements in commodity prices, or supply/demand shifts.
Once you have identified the items that are both meaningful in size and meaningfully impacted by shifts in underlying cost drivers, the next step is to quantify the savings opportunity. If you want to have credibility and solid footing to stand on when the time comes to re-negotiate with suppliers or go to market for this item, you will need a quantification that is grounded in credible and relevant data. - Examine the item-level cost models for prioritized items (see below for detail)
- Run ‘should-cost’ analysis to quantify the savings opportunity
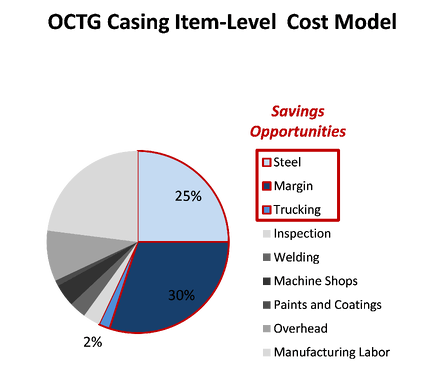
To illustrate in more detail, we turn back to our OCTG example. Below is an item-level cost model for OCTG casing. As you can see, OCTG casing costs are driven predominantly by steel, trucking, supplier margin, and various types of labor.
While its interesting to know what drives the cost of OCTG casing, the real value is in taking this information and determining what it “should-cost” based on how these underlying cost drivers have moved, or will move in the future.
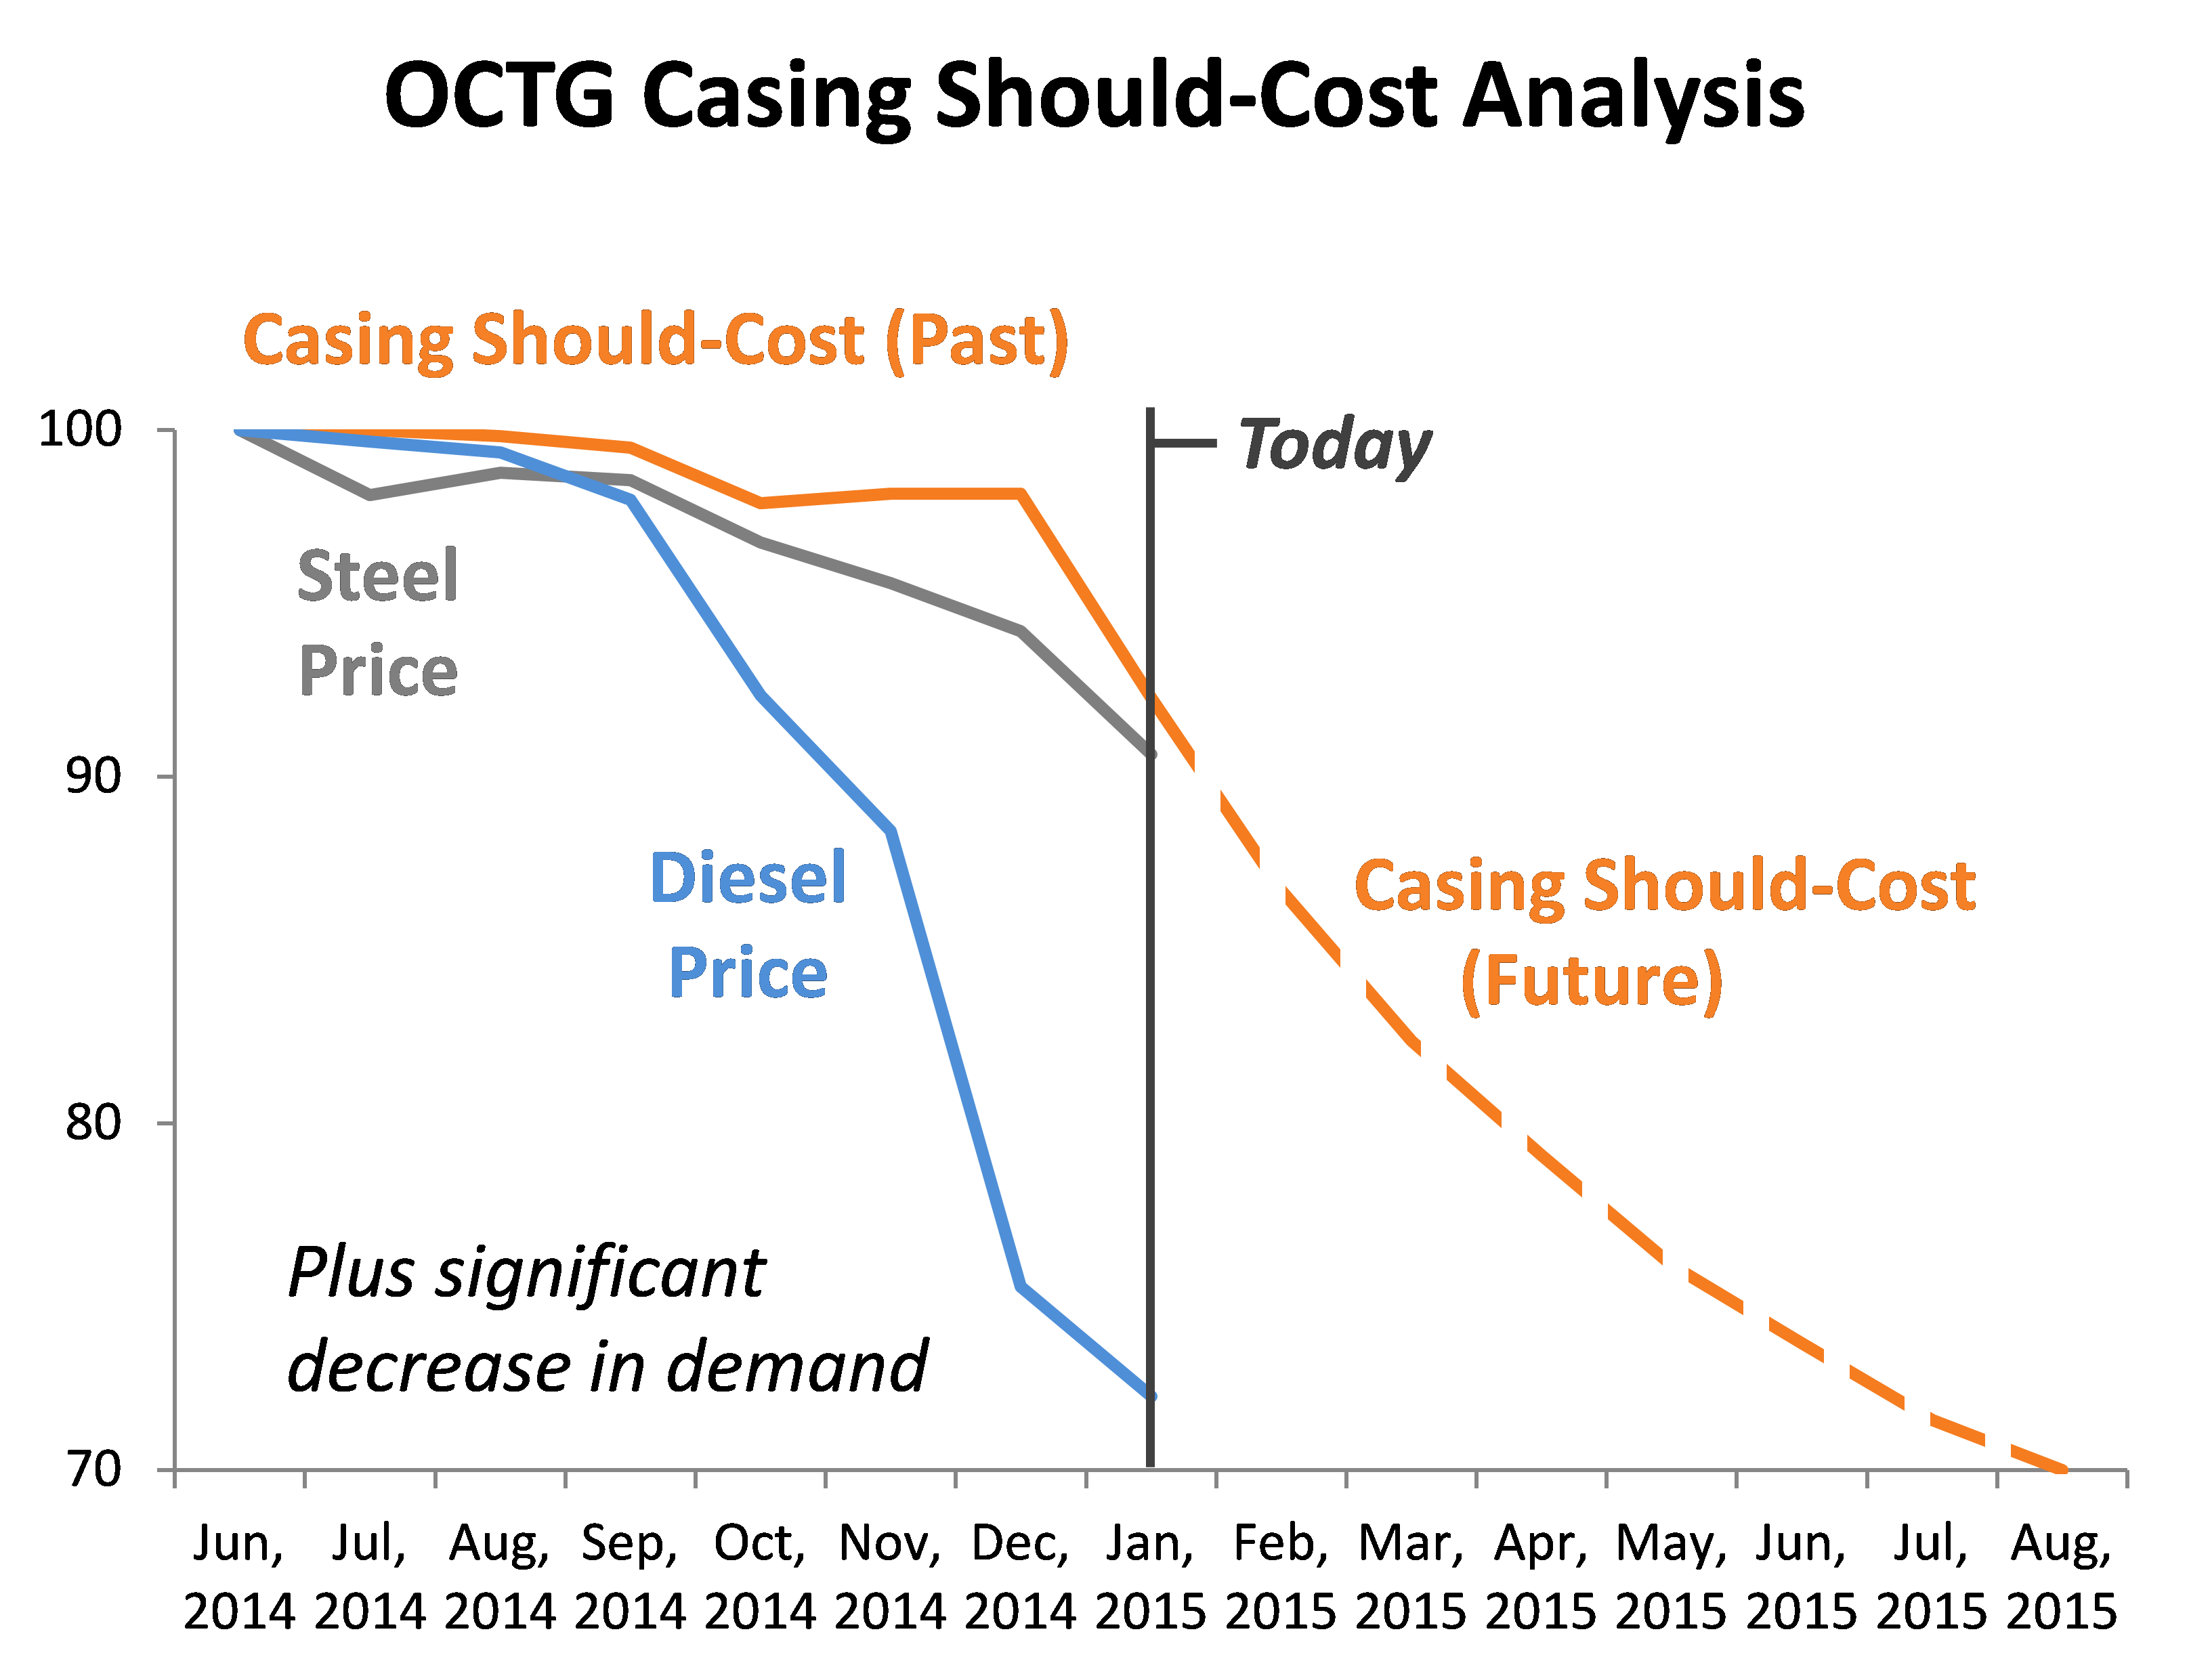
For the OCTG casing example, for instance, we know that three of suppliers’ major cost drivers have been significantly impacted in the last 6-9 months: steel, trucking, and margin.
- Steel: Steel prices dropped 10% from June 2014 to January 2015. With steel accounting for 25% of OCTG casing costs, this should translate into a 2.5% savings opportunity in OCTG casing.
- Trucking: Diesel prices, which account for 2/5 of freight costs, dropped 28% from June 2014 to January 2015. With trucking costs accounting for 2% of OCTG casing costs, we should expect to see an additional 0.25% savings opportunity.
- Supplier Margin: The largest and most negotiable cost driver of OCTG casing is supplier margin. 30% of OCTG costs are effectively contribution margin to the supplier in times of high demand. However, as demand for OCTG declines (which it has significantly considering the 18% drop in rigs count from November 2014 to February 2015), OCTG suppliers have mills which are running below capacity. And in such a situation, producers are often willing to reduce their price to the point of marginal cost, which based on our cost model is 70% of their price in times of high demand (e.g., 2014 prices).
Taken together, these market shifts indicate a ~33% savings opportunity in OCTG.
A ‘should-cost’ analysis does just this across the entire set of cost components of any particular item. It uses data about movements in each underlying cost driver and determines what the item ‘should cost’ at a given point in time. These models can be incredibly powerful both in identifying and quantifying savings opportunities to pursue, as well as in executing on those opportunities through fact-based supplier negotiations.
How to Execute on the Savings Opportunity
For prioritized savings opportunities, we have seen E&P companies achieve great success in supplier negotiations and sourcing events by bringing all the relevant facts and data to the table. For example, some customers opt to build ‘Savings Packets’ for each supplier negotiation. A Savings Packet might include:
- [Company] ‘story’ to review history of relationship and rationale for need for cost reduction
- Data required for fact-based savings capture:
- Category-, item-, and supplier-level spend profiles
- Supplier fact base
- Historical pricing and contract analysis
- Cost driver price movements
- Supply / demand commentary
- Item-level Cost model
- Item-level ‘should-cost’ analysis
Armed with this information, you are much more likely to drive the maximum amount of savings as a result of the changing market conditions…which can often amount to much more than 20%!
Need help accessing the data needed for this (and other) analysis?
Need help running the analysis?
Need help executing supplier negotiations?
We can help – ask us how.