This post lays out the details behind a tactical execution of Price Variance Analysis, and provides strategies for standardizing inconsistent pricing. Specifically, it outlines:
- Data requirements: What data do you need access to?
- Steps of the analysis: What are the steps to follow in running the analysis?
- Suggestions on execution: How have we seen other companies actually execute and realize the savings opportunities uncovered by the analysis?
Data Requirements
Below is the data needed to effectively run this analysis. If you do not have access to all this data, you are not alone…many E&P companies are in the same boat. We can help – just ask us how.
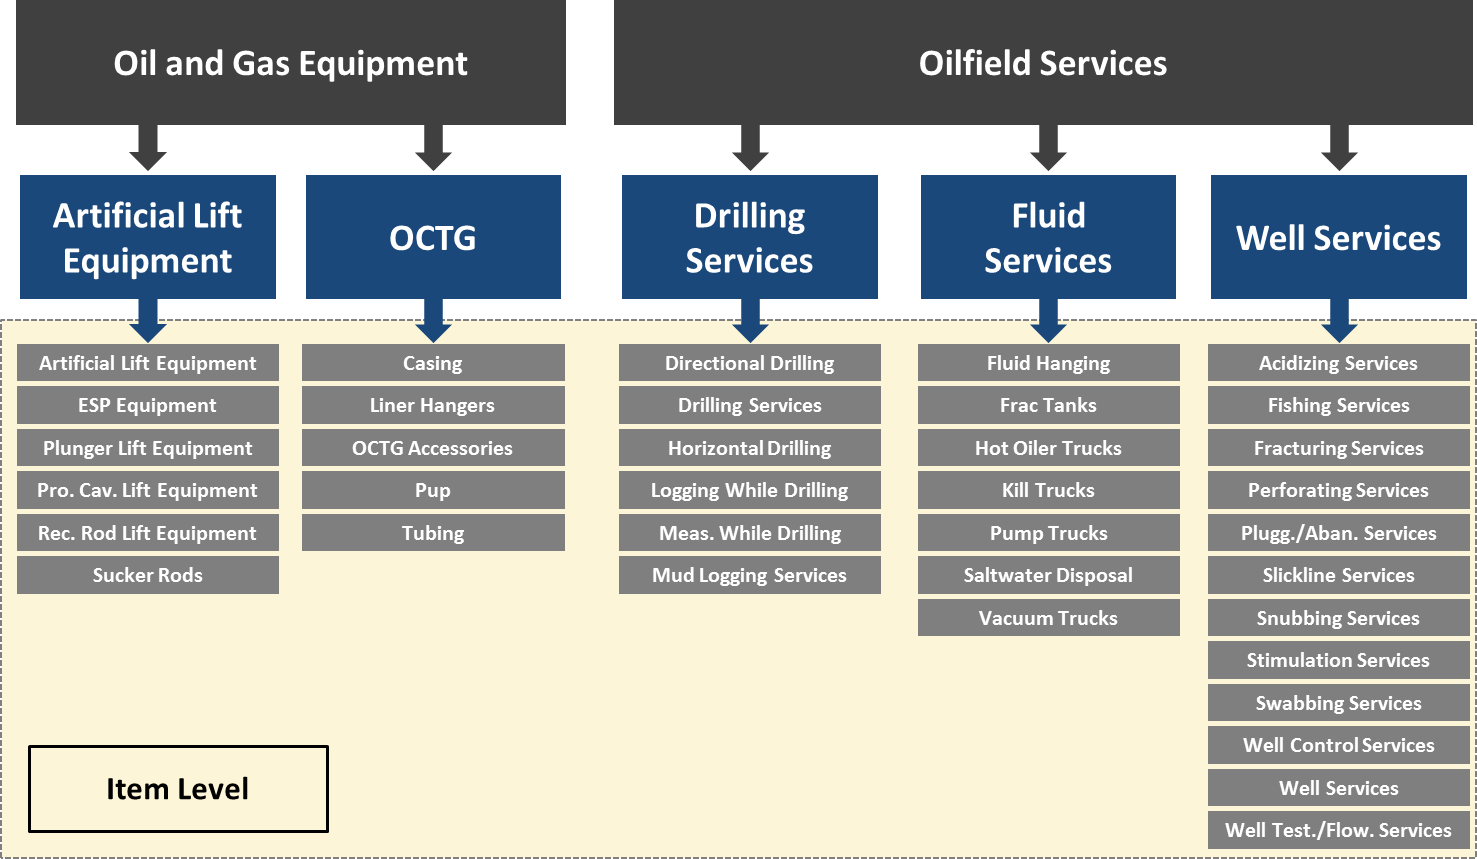
1. Item-Level Spend Data: First and foremost, to evaluate price variance within major spend items, you need item-level spend data. Even if you have complete, accurate categories and subcategories, without item-level detail you cannot make the apples-to-apples comparisons necessary to conduct this analysis. For instance, let’s say you want to evaluate price differences across your line hanger purchases. If your oil and gas equipment schema only drills down to “OCTG,” then you can’t easily differentiate line hanger purchases from casing, tubing, and pup joint purchases. Below is a 2-category sample of a schema granular enough to conduct Price Variance Analysis.
2. Accurate Per-Unit Pricing Data: Equally important to conducting this analysis is accurate per-unit pricing information. Oftentimes we see datasets with pricing information riddled with hand-entered errors or without any cost-per-item information whatsoever. If you’re in this camp, you can certainly conduct higher-level spend analyses, but will struggle to standardize pricing across your major items.
3. Line Item Descriptions: Line item descriptions allow you to parse out different variations of the same items so that you’re truly comparing identical products when you conduct Price Variance Analysis. For instance, OCTG Casing is an item-level classification, but within this classification exist numerous combinations across length, weight, and other distinctions, all of which are made visible through line descriptions.
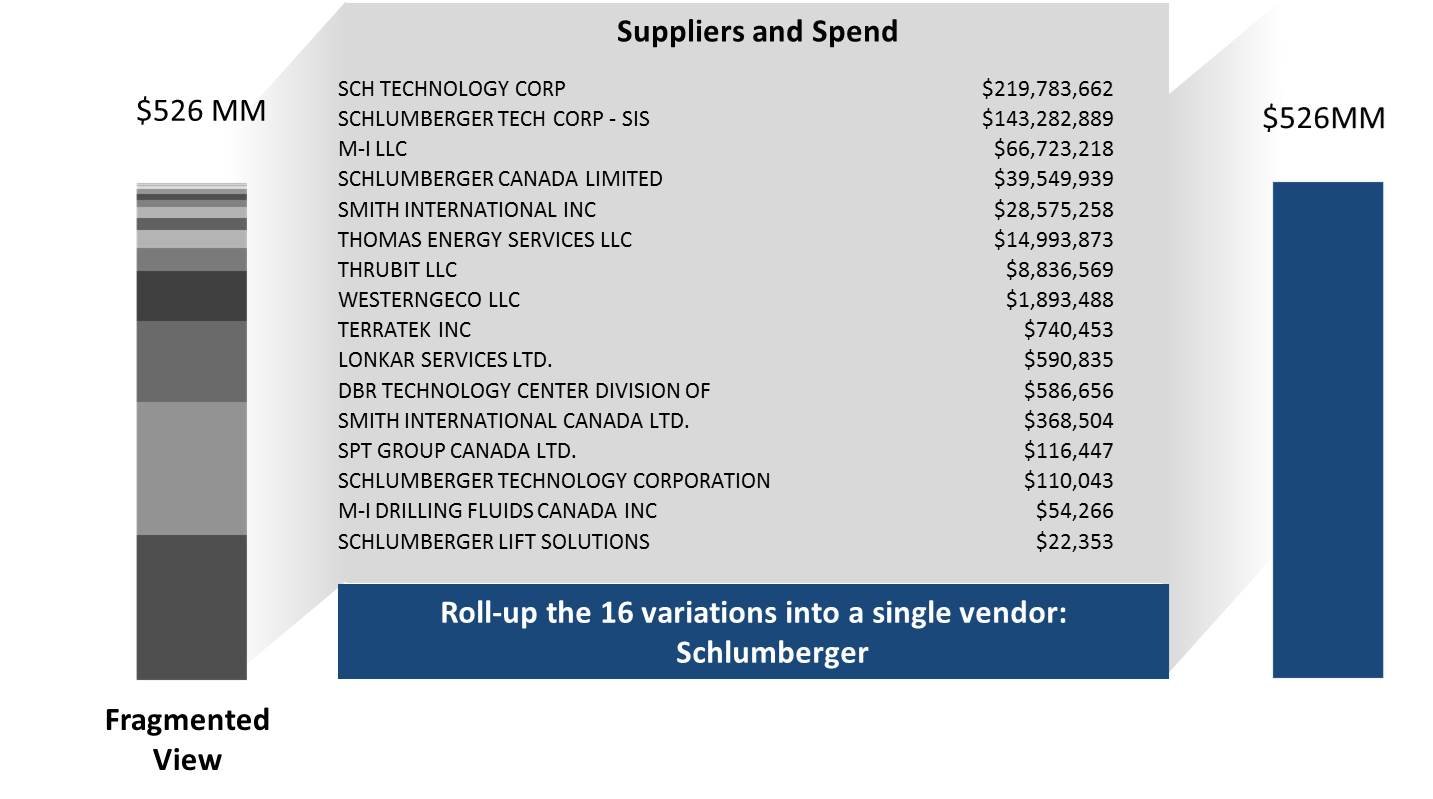
4. Fully Rolled-Up Supplier Families: Most major E&P firms purchase products and services from both parent companies and their subsidiaries, but fail to fully consolidate supplier families into individual ‘buckets’ of spend. To most effectively evaluate the range of prices a given supplier charges you, you need to incorporate that supplier’s ‘family’ spend as well. The chart below depicts a real life example of E&P company data before and after it invested in proper supplier familying.
How to Run the Analysis and Identify the Savings Opportunity
With the right data quality, executing this analysis is really quite simple. Below are the steps required to identify savings opportunities using Price Variance Analysis:
- Rank order your top spend items. Materials are far easier to make apples-to-apples comparisons with, so prioritize them over services initially.
- For each item, export transactional data for the last 4 quarters. Make sure to include the following data fields: supplier, date, pricing, item description, and basin/region.
- Sort the data by item description, and determine whether or not “items within items” exist in your dataset. Cross-referencing other fields like per-unit pricing can be helpful here; if you paid wildly different prices for 2 items, they likely differ on some dimension. For some, more commoditized, items like caustic soda, there won’t be much variation in line description. For others, like OCTG Casing, there will be a great deal of variation due to contrasting dimensions, grades, etc. In cases like these, you should determine which are your highest-spend item descriptions, isolate them, and evaluate each of them individually.
- Once you feel you can make apples-to-apples comparisons across an item’s transactions, you can choose to parse these transactions by basin, or to instead conduct a Price Variance Analysis that spans all regions.
- Furthermore, you can also choose to segment transactions by supplier if you’re seeking to gain insight into price variance with specific vendors.
- Arrange the “date” field to be adjacent to the unit-price field in your dataset. Then, sort the data from the earliest transaction to the latest.
- Highlight both columns, and create a scatterplot. This will provide a strong visual representation of how much your prices vary, both within the same time frames, and over time.
How to Execute on the Savings Opportunity
While eliminating price variability entirely is an unrealistic ambition – short-notice “hot shot” orders are sometimes unavoidable – you can take several steps to standardize prices. Once you determine which of your items you pay highly disparate prices for, you should approach each of the largest vendors you buy these items from with a simple message.
First, present the data to them. Providing statistics like the percentage of transactions where you paid above-contract price with them should resonate. Make it clear you will be tracking price variance moving forward, and propose the following to each supplier: “If I approach you before my other suppliers for hot-shot orders of this item, I expect to only pay this minimal premium”. Suggesting that your suppliers build up inventory and capabilities to facilitate your short-order needs is also worthwhile.
Once your suppliers agree to honor certain hot-shot pricing premiums, rank them by cost-effectiveness, and provide this list to every one of your company men with the edict that they start at the top of the list when needing ordering an item on short notice. This will prevent them from calling the supplier they’re most comfortable with, and ensure they pay the lowest premium possible every time. Executing this strategy across all of your major high-spend, high-price-variance items will result in tens of millions of dollars in savings each year.
Need help accessing the data needed for this (and other) analysis?
Need help running the analysis?
Need help executing supplier negotiations?
We can help – ask us how.