![]()
In our last post, we revealed how E&P firms can leverage Supplier Efficiency Analysis to drive back inefficiency costs like Stand-By Time. This post – the 4th in our Smart Savings Series – covers another supplier benchmarking technique: Supplier Pricing Analysis. Comparing vendors across per-unit pricing is an exercise that, despite its simplicity and obvious value proposition, isn’t conducted regularly at most E&P companies in our experience. Firms that do consistently identify and eliminate price discrepancies between suppliers for major spend items generally achieve an additional 10-20% savings on these items.
What is Supplier Pricing Analysis?
E&P firms typically source many of their high-spend items from more than one supplier, as doing so reduces risk on their end. However, supplier diversification comes hand-in-hand with the unfortunate byproduct of disparate pricing. Differences of 1–2% are to be expected, given factors like supplier location and freight costs. However, when you pay a 5% or greater premium with one supplier over another, there’s almost certainly an opportunity for price standardization.
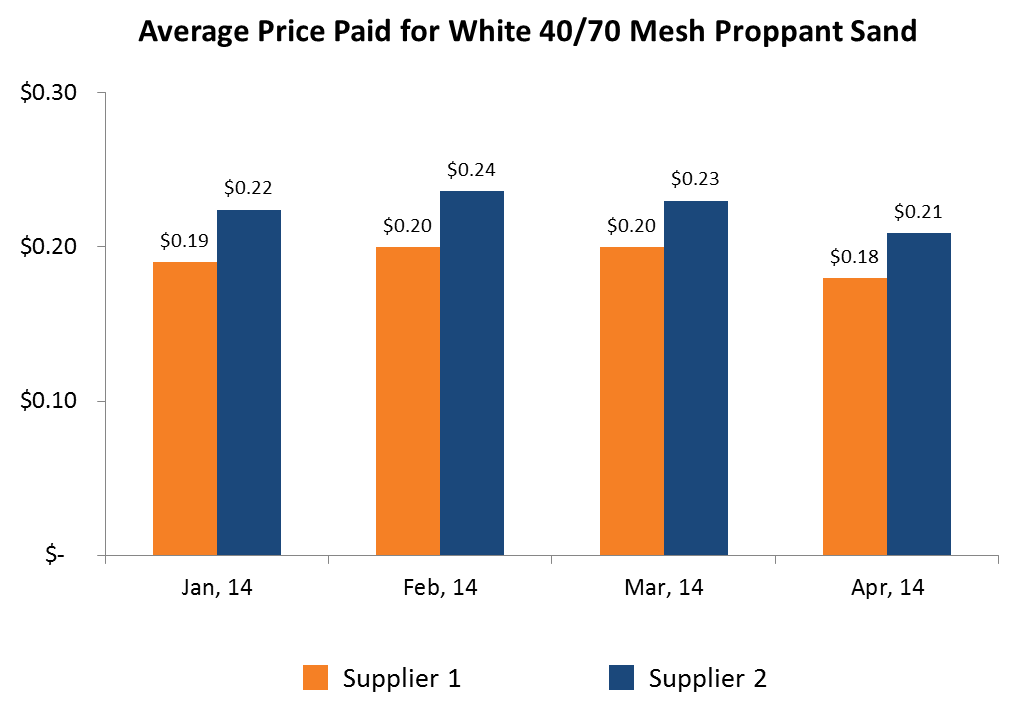
Supplier Pricing Analysis is a method of comparing suppliers’ prices to determine where large discrepancies lie. The chart below depicts a Supplier Pricing Analysis that PowerAdvocate conducted for an E&P client (actual data has been disguised). It reveals that the firm’s largest oilfield services supplier consistently charged more than its second largest supplier for one type of proppant sand. Over the course of a year, the average premium paid was 16%, and the annual cost in foregone savings was over $7 Million per year. When expanding the analysis to all proppant sands, the cost escalated to ~ $18 Million per year.
Why Price Discrepancies Exist and How to Address Them
Price discrepancies can be attributable to contrasting supplier profit margins, economies of scale, product tying agreements, or dozens of other variables. Furthermore, the prices E&P firms pay with any given supplier often differ from base contract prices due to consistent off-contract, ‘rogue’ spending. However, the ultimate reasons why prices differ are often less valuable to you than the data showing they do differ in the first place. For instance, even if price differences are largely attributable to internal practices on your end (e.g., your Company Men making frequent ‘hot shot’ orders), you can still make a data-driven push for discounts with the suppliers you consistently pay premiums with.
Actually conducting Supplier Pricing Analysis is fairly straightforward. You simply need to determine the average monthly price you pay for each of your top spend items across suppliers, over the course of the last year. You should focus on commodity and stock items to ensure you’re making apples-to-apples comparisons. Then, look for notable discrepancies and trends over time (e.g., do you have a premium that has grown larger over the last year?). Once you’re able to quantify the premiums you pay with certain suppliers, you can contrast their pricing versus your most favorable pricing in future negotiations to standardize the two.
If you’re interested in a more tactical step-by-step guide to conducting Supplier Pricing Analysis, we invite you to read our follow-on post, Tactical Savings Guide – Supplier Pricing Analysis.