At it’s core, conducting spend analysis to inform sourcing strategies relies on answering two basic questions about every transaction:
- What are you spending this money on?
- Who are you spending it with?
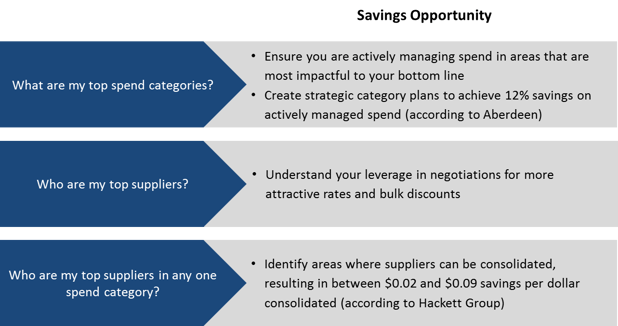
If you are able to answer these questions, you can answer the more complex questions listed below, and achieve significant savings:

The problem is, there are numerous obstacles that erode your ability to answer these basic two questions. At PowerAdvocate, having analyzed $2 Trillion in energy spend data, we’ve been able to identify common issues that have impeded energy companies from extracting full value from their data - costing them millions of dollars in lost savings opportunities.
1. Your data is incomplete
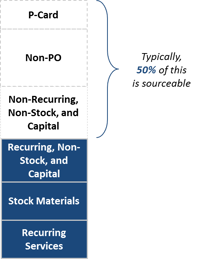
Unclassified information obstructs visibility into your spend data. Through our experience, we’ve found about 43% of enterprise spend from ERP systems is classified as “blank”. So, you may not be leveraging almost half of your data to answer the questions: with who? And, on what?
ERP data that is classified this way is usually non-PO spend. There is a common misconception that non-PO spend is not sourceable, when in reality we find that, on average, 50% of it is.

Getting visibility into this blank spend can unlock huge savings opportunities, and can help you identify maverick spend that should have been on-contract purchases.
2. Your data is inaccurate
Of the remaining data that is not blank, and is classified, we find inaccuracies in both the who and the what. For example, on average, 2 in 5 suppliers are duplicates in spend data that we receive from customers. This can be attributed to two things:
- Inability to recognize subsidiary relationships, and roll up spend to the parent entity
- Inconsistencies in naming conventions for suppliers, likely as a result of aggregating data from disparate systems
Duplicates can be dangerous because they dilute your spend across different entities that in actuality, represent 1 supplier. This misleads your ability to understand how much you spend with any one supplier, and who your top suppliers are in any one category. Often our customers uncover they are spending twice what they originally thought with a top supplier through deduping, increasing their leverage in negotiations and resulting in better terms and rates.
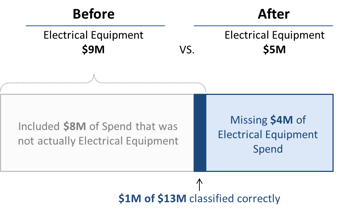
Duplicates are bad for business, but even worse are errors in classifications describing what was purchased. For a given category we usually find a percentage of spend to be incorrect, and a percentage of spend distributed amongst other categories. In worst cases we see 5-10% accuracy at a category level.

This is an example of what 10% accuracy looks like: 90% of the classified spend was inaccurate; the 60% that did not belong in the category, and the 30% that was found categorized in other categories. Spend Data that is inaccurate is even more destructive to the spend analysis process than “blank” or nonexistent spend data, because it can give you false conclusions to inform bad decisions.
3. Your data is not granular enough
After cleansing $2T of energy spend data, PowerAdvocate knows that between 40-60% of spend that is classified ends up in one of these 3 categories: “Services - other” “Services - general” “Services – misc.”. This data may as well be categorized as “blank” because these descriptions are too vague to analyze or act on. Even the category “Electrical Equipment” used in the previous example fails to fully answer the question – what did you spend your money on?
None of these classifications represents items you actually go to market and buy. More granularity about what type of electrical equipment, like transformers, transformer components, or wire and cable, would inform more effective savings strategies.
4. Your data is inaccessible
At this point, 43% of your data is unclassified, in the remaining 57% of your data, 40-60% is classified in a vague category like “services-misc” and the last remaining 23-34% of your data contains a number of inaccurate and equally unspecific categorizations. But before even getting here, a huge problem that spans industries and companies of all sizes is simply the inability to access this dataset at all. This could be the case for a few reasons:
- Your spend data is dispersed across disparate systems, like your ERP, AP, and P-card systems
- Because your data lives in these different systems, that all collect data on different parameters and in different formats, it’s a massive undertaking to aggregate and normalize
- Your company may not have the human capital, budget, or priority to fund a tool that could aggregate and cleanse all of the data
- A recent merger or acquisition has complicated this situation more, adding another disparate ERP system and additional source systems into the mix.
For these reasons and likely others, you may not be able to aggregate any or even most of your spend data, which means you can’t even begin to answer your two fundamental questions.
The Bottom Line
Many energy companies are surprised to find that there were so many issues with their data. Most believed that they had an accurate view of about 80% of their data, only to find once we’ve cleansed it that their view was much more limited.
Companies who make it a priority to fix their data issues, and make use of their spend data as a tool for savings, end up reducing their bottom line, while adding transparency and accountability to how their organization spends money.
Do you think your organization has a spend data problem?
View our list of recommendations and tools on how you can begin to solve it:

