This post lays out the details behind a tactical execution of Regional Fragmentation Analysis (if you’re not sure what Regional Fragmentation Analysis is, check out our high-level intro piece on the subject), and provides strategies for consolidating spend around top suppliers. Specifically, it outlines:
- Data requirements: What data do you need access to?
- Steps of the analysis: What are the steps to follow in running the analysis?
- Suggestions on execution: How have we seen other companies actually execute and realize the savings opportunities uncovered by the analysis?
Data Requirements
There are only two data requirements to run this analysis: rolled-up supplier families, and regional transaction data. However, if you do not have access to this data organization and/or quality, you’re not alone…many E&P companies are in the same boat. We can help – just ask us how.
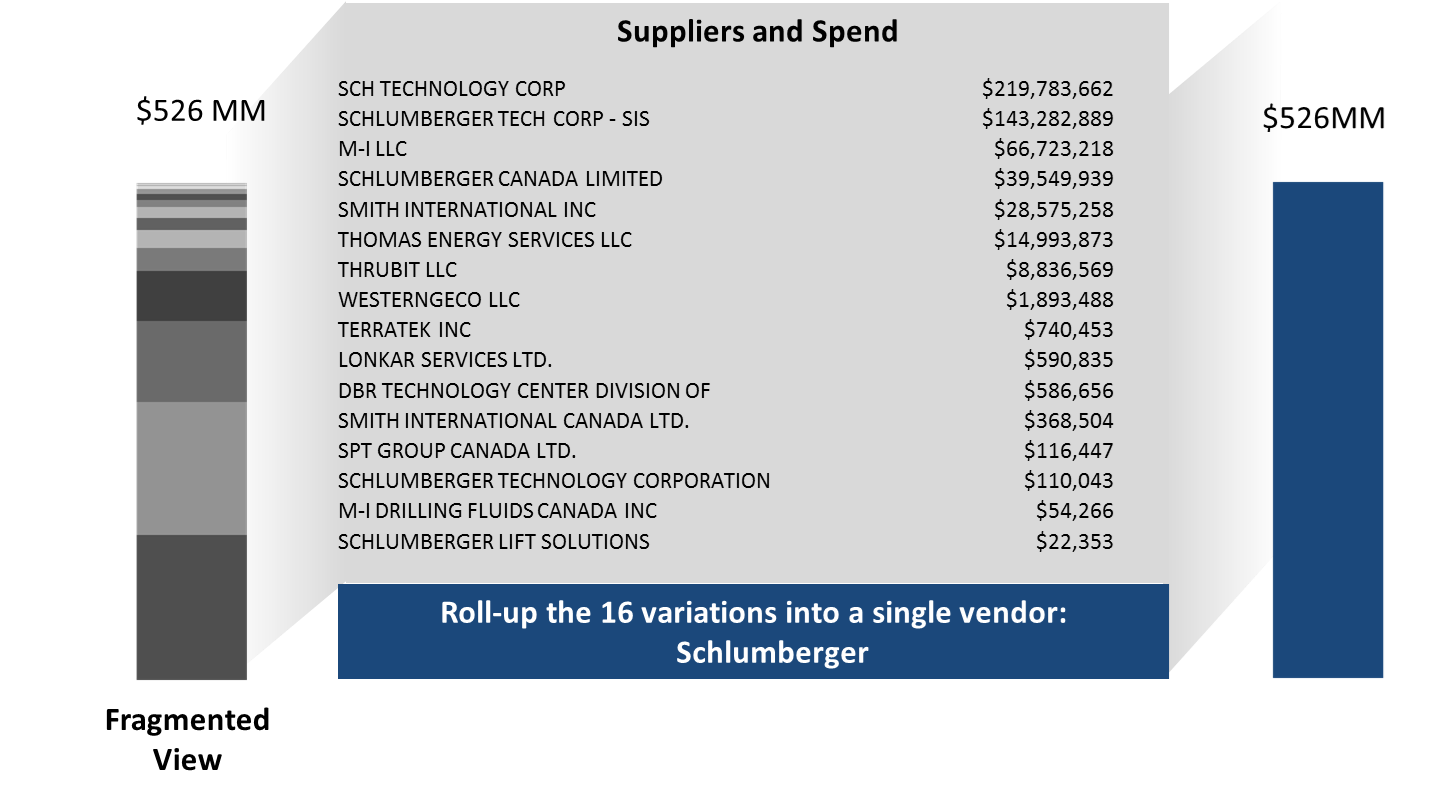
Fully Rolled-Up Supplier Families: Without complete and accurate supplier hierarchies, this analysis will produce results that mislead your consolidation efforts, and ultimately cost you significant discounts. First, you may fail to consider certain vendors as top suppliers because their subsidiaries have not been rolled up. Second, the percentages of category spend you will benchmark across regions will likely be inaccurate, as parent and child organizations often operate in the same areas. Ultimately, acting on this incomplete information will cost you time, supplier leverage, and savings.
To underscore the importance of proper supplier organizations, we’ve provided the chart below, which depicts a PowerAdvocate client before and after it invested in supplier familying.
Regional IDs at the Transaction Level: It should come as no surprise that conducting a Regional Fragmentation Analysis is not possible without regional transaction data. At the very least, you need to be able to break out spend with a top supplier by broad areas of operation (e.g., East, West etc.). However, if possible, you should also segment data by basin (see regional hierarchy below) to add granularity to your analysis.

How to Run the Analysis and Identify the Savings Opportunity
With the right data quality, conducting this analysis is a straightforward process. Here are the steps required to identify savings opportunities using Regional Fragmentation Analysis:
- Rank-order your top suppliers.
- Export spend data with your top supplier for the last four quarters. Be sure to include category and regional variables.
- Separately export total spend data on all of the categories this top supplier is represented in. Spend with every suppliers should be present in this data, and again, a regional variable should be included.
- For each category relevant to the top supplier, and across all regions, divide the amount you spent with this supplier by the total amount you spent over the last year. This will leave you with percentages of category spend by region to benchmark.
- Create a column chart that reflects these percentages across categories and regions.
- Repeat Steps 1 – 5 for as many top suppliers as you see fit.
How to Execute on the Savings Opportunity
Once you’ve conducted a Regional Fragmentation Analysis, your potential consolidation opportunities should be quite apparent; look for major discrepancies between regional percentages within each category. For instance, in the graph above, the biggest opportunities with Supplier A appear to be in Drilling Services, Artificial Lift Services, Bulk Chemicals, and Oil & Gas Equipment. Once you’ve identified this low-hanging fruit, you’ll need to take three courses of action to fully realize savings: (1) Determine which opportunities are actionable, (2) Renegotiate contracts around consolidation, and (3) Ensure contract compliance.
Evaluating Opportunities: Not every regional percentage discrepancy will be actionable. For instance, you may not be able to consolidate spend on certain services with a top supplier because this supplier simply does not offer these services in a given region. Thus, determining which spend allocations can be feasibly redistributed is a key first step to take.
Renegotiating Contracts: Before redistributing future spend around a supplier, you need to renegotiate discounts with this supplier that fully compensate for this consolidation. You should leverage the data from your Regional Fragmentation Analysis in these talks, and highlight how much you spend with the supplier across categories and regions.
Ensuring Contract Compliance: Once you’ve cut a fresh contract around redistributed spend with a supplier, you cannot assume your teams in the field will adhere to it. Through whatever internal training or directive processes you have, you need to ensure that the new business promised to the supplier is, in fact, delivered to them. If you follow these three steps, and repeat this process across all of your major suppliers, you should achieve 10%+ savings across newly consolidated categories.
Need help accessing the data needed for this (and other) analysis?
Need help running the analysis?
Need help executing supplier negotiations?
We can help – ask us how.