We recently hosted a cost reduction webinar highlighting simple analyses that refiners and petrochemical companies can use to uncover millions in savings across their supply base.
In case you missed it, we’ve pulled out a few of the highlights below. Today we’ll focus specifically on price variance analysis, an analysis that helps answer questions like:
- Does your price paid match your contract price?
- Are there erratic fluctuations in your prices?
- Are different suppliers charging different unit prices for the same item?
- Are you receiving the discounts that suppliers committed?
- Are the prices you’re paying moving in line with the market or are they staying flat over time?
Price variance occurs for a number of reasons: buyers may be buying off contract, suppliers may not be charging their contracted prices, and different suppliers may have different price points. But no matter the reason, unit pricing analysis can be incredibly valuable for capturing quick savings wins.
Scroll down for a brief intro video and a 5-step guide to eliminating price variance.
The 5- Step Guide to Price Variance Analysis:
- Identify your top spend items: In order to prioritize your efforts, we recommend rank ordering the items and services you buy from top to bottom so that you can start by eliminating inefficiencies in the highest spend items. We also recommend starting with materials, because it’s often easier to make apples-to-apples comparisons among line items. In particular, commoditized items such as chemicals, pipe, fittings and valves are all well suited for this type of analysis.
- Find out what prices you paid for top spend items: Export the last 8 quarters of transactional spend data with the following descriptive fields: supplier, item description, unit price, unit of measure, quantity, date and business unit. This arms you with the data necessary to track prices over time.
- Organize your data to show costs over time—oldest to most recent: Simply filter by your top spend item descriptions and sort the data by date. This ensures you narrow your scope to key items and compare exact transactions across time.
- Create a scatter plot to visualize price and variance over time: Create a scatter plot from your date and unit price columns to graph all the prices you’ve paid for a particular item over time and readily highlight any areas of variance
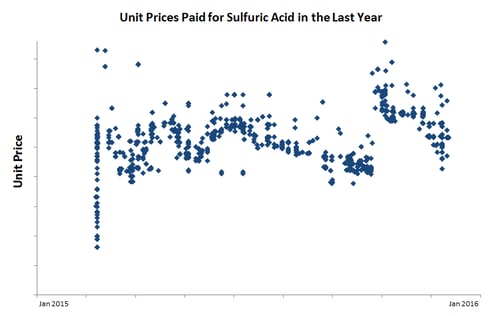
For instance, the graph above demonstrates a firm’s sulfuric acid unit pricing across its vendors. The visual representation of the data makes it readily apparent that prices for the same item have varied significantly.
- Pinpoint the source of price variance and address with data: Once you have a sense of whether you have sizeable price range on a particular item, the next step is to identify why. We often recommend cutting the data by supplier or by region to identify if those characteristics can explain the difference and suggest areas to focus in on.
Now that you’ve found your prices vary—how can you leverage this data to save? We recommend two paths forward:
Eliminate variance with an individual supplier: Present a graph like the one above and clearly outline the percentage of transactions where you paid above-contract price for an item. This initiates a fact-based discussion that is hard for suppliers to ignore and demonstrates that you can easily track prices to drive accountability.
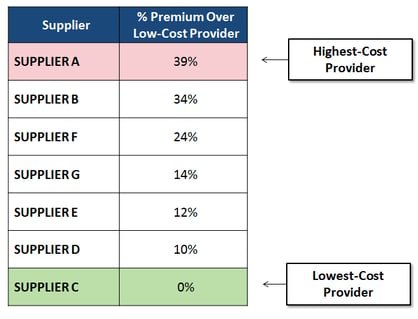
Eliminate variance across suppliers: Quantify how one supplier’s pricing compares to the next. For instance, in the table below, we’ve benchmarked each supplier’s sulfuric acid pricing vs. the low cost supplier.
With this data, you can identify which high-cost suppliers to eliminate and which low-cost providers to drive greater volume toward.
We’ve also seen the same data used internally to drive savings. Being able to clearly demonstrate variance resultant from off-contract purchases can serve as an important first step in engaging stakeholders, from buyers to business units, to prioritize eliminating off-contract spend .
Any questions about executing this analysis with your own data—or how to access the data needed for price variance analysis? Let us know.