In this post, we’ll demonstrate how to benchmark vendors in a more meaningful, holistic way through Vendor Productivity Analysis. Whereas most E&P firms award bids based on service or material rates (after a threshold of quality, safety, etc. is reached), they should compare suppliers by costs-per-unit directly tied to total historical cost of work. For instance, across completions activities like Wireline and Perforating Services, a vendor’s historical dollars per stage or lateral foot is a far more useful metric than dollars per hour.
How to Execute this Analysis
With accurately classified spend data tied to a well data management solution like WellView, conducting this analysis on a category like wireline takes just a few steps. First, export all your wireline spend from the last four quarters into a data analysis tool like Excel, including spend amounts, supplier names, lateral lengths, stages, fields, well names, pad names, and completions dates. Then, simply calculate well and pad costs per stage and lateral foot, and determine which suppliers are associated with higher- vs. lower- cost assets.
Any number of analysis variations can be run here. For example, if you're interested in looking at your cost per stage spectrum across wells in one of your Permian fields, your outputs may look something like this:
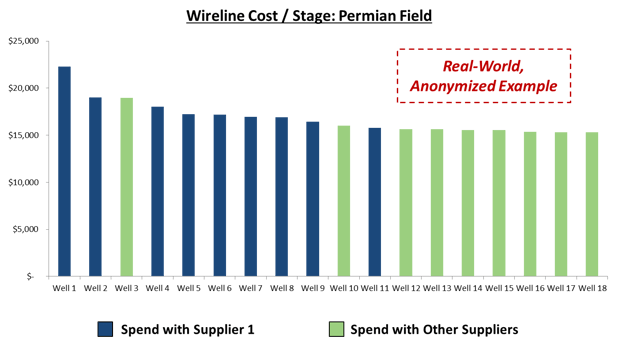
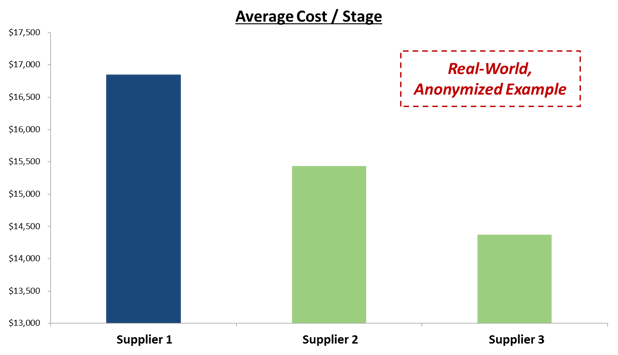
These outputs are hugely valuable, as they indicate the total cost of doing business with any given wireline supplier. In the charts above, you can see this firm’s highest-cost-per-stage pads in one field were predominately contracting with Supplier 1, and that Supplier 1 came in at a 20%+ premium to Supplier 3 on a composite basis. When conducting this analysis, you may also find, as this firm did, that your lowest-rate suppliers are not your lowest-cost-per-stage suppliers!
Important Caveats for this Analysis
For Vendor Productivity Analysis to be accurate, you need to ensure you are making apples-to-apples comparisons across wells and pads. Doing so requires you take the following measures:
- Ensure you are capturing all category spend. If you have significant non-wireline spend misclassified as wireline, and/or vice versa, this analysis will lead you to erroneous conclusions. For more information on driving the requisite level of data accuracy, reach out to our Spend Intelligence® team.
- Ensure your well data management solution is cleanly connected to your spend data. If a wireline vendor’s spend is incompletely linked to wells, pads, rigs, etc., it will appear to have lower per unit figures than it should. Again, reach out for more information on how to do this.
Note: You may have to manually link your spend data and well data together through a common data field or set of fields.
- Ensure you omit wells from your analysis that began completions before the earliest date in your data’s completions time frame, or ended completions after the latest date. For example, if you pull data from Oct. 1st ’14 – Oct. 1st ’15, data on a well with a “Rig Up Wireline” date of Sep. 25th ’14 will be incomplete.
- Conduct this analysis within fields, as well as across fields. While wireline is considered a “commodity service” due to its similarities across regions, intra-field analysis will ensure the highest consistency of operating circumstances.
How to Leverage the Outputs of this Analysis
This analysis will show you where potential, rather than definitive, inefficiencies lie. For instance, one wireline vendor may have a higher cost per stage than others, but provide discounts on separate services that others do not. Furthermore, a more expensive provider may be a higher-quality provider across any given set of parameters. Thus, we suggest conducting this analysis across as many categories as possible, and considering factors like quality in concert with cost per unit metrics.
If and when you feel there is no justifiable reason for a cost per unit discrepancy, you should leverage Vendor Productivity Analysis in future supplier negotiations with your more expensive vendors to drive down total cost and/or drive spend with these vendors towards your less expensive vendors.
Curious to learn more about Vendor Productivity Analysis? Contact us, and we’ll give a more in-depth overview.